Data Dashboard Supports the NHS to Evidence the Value of Creative Health
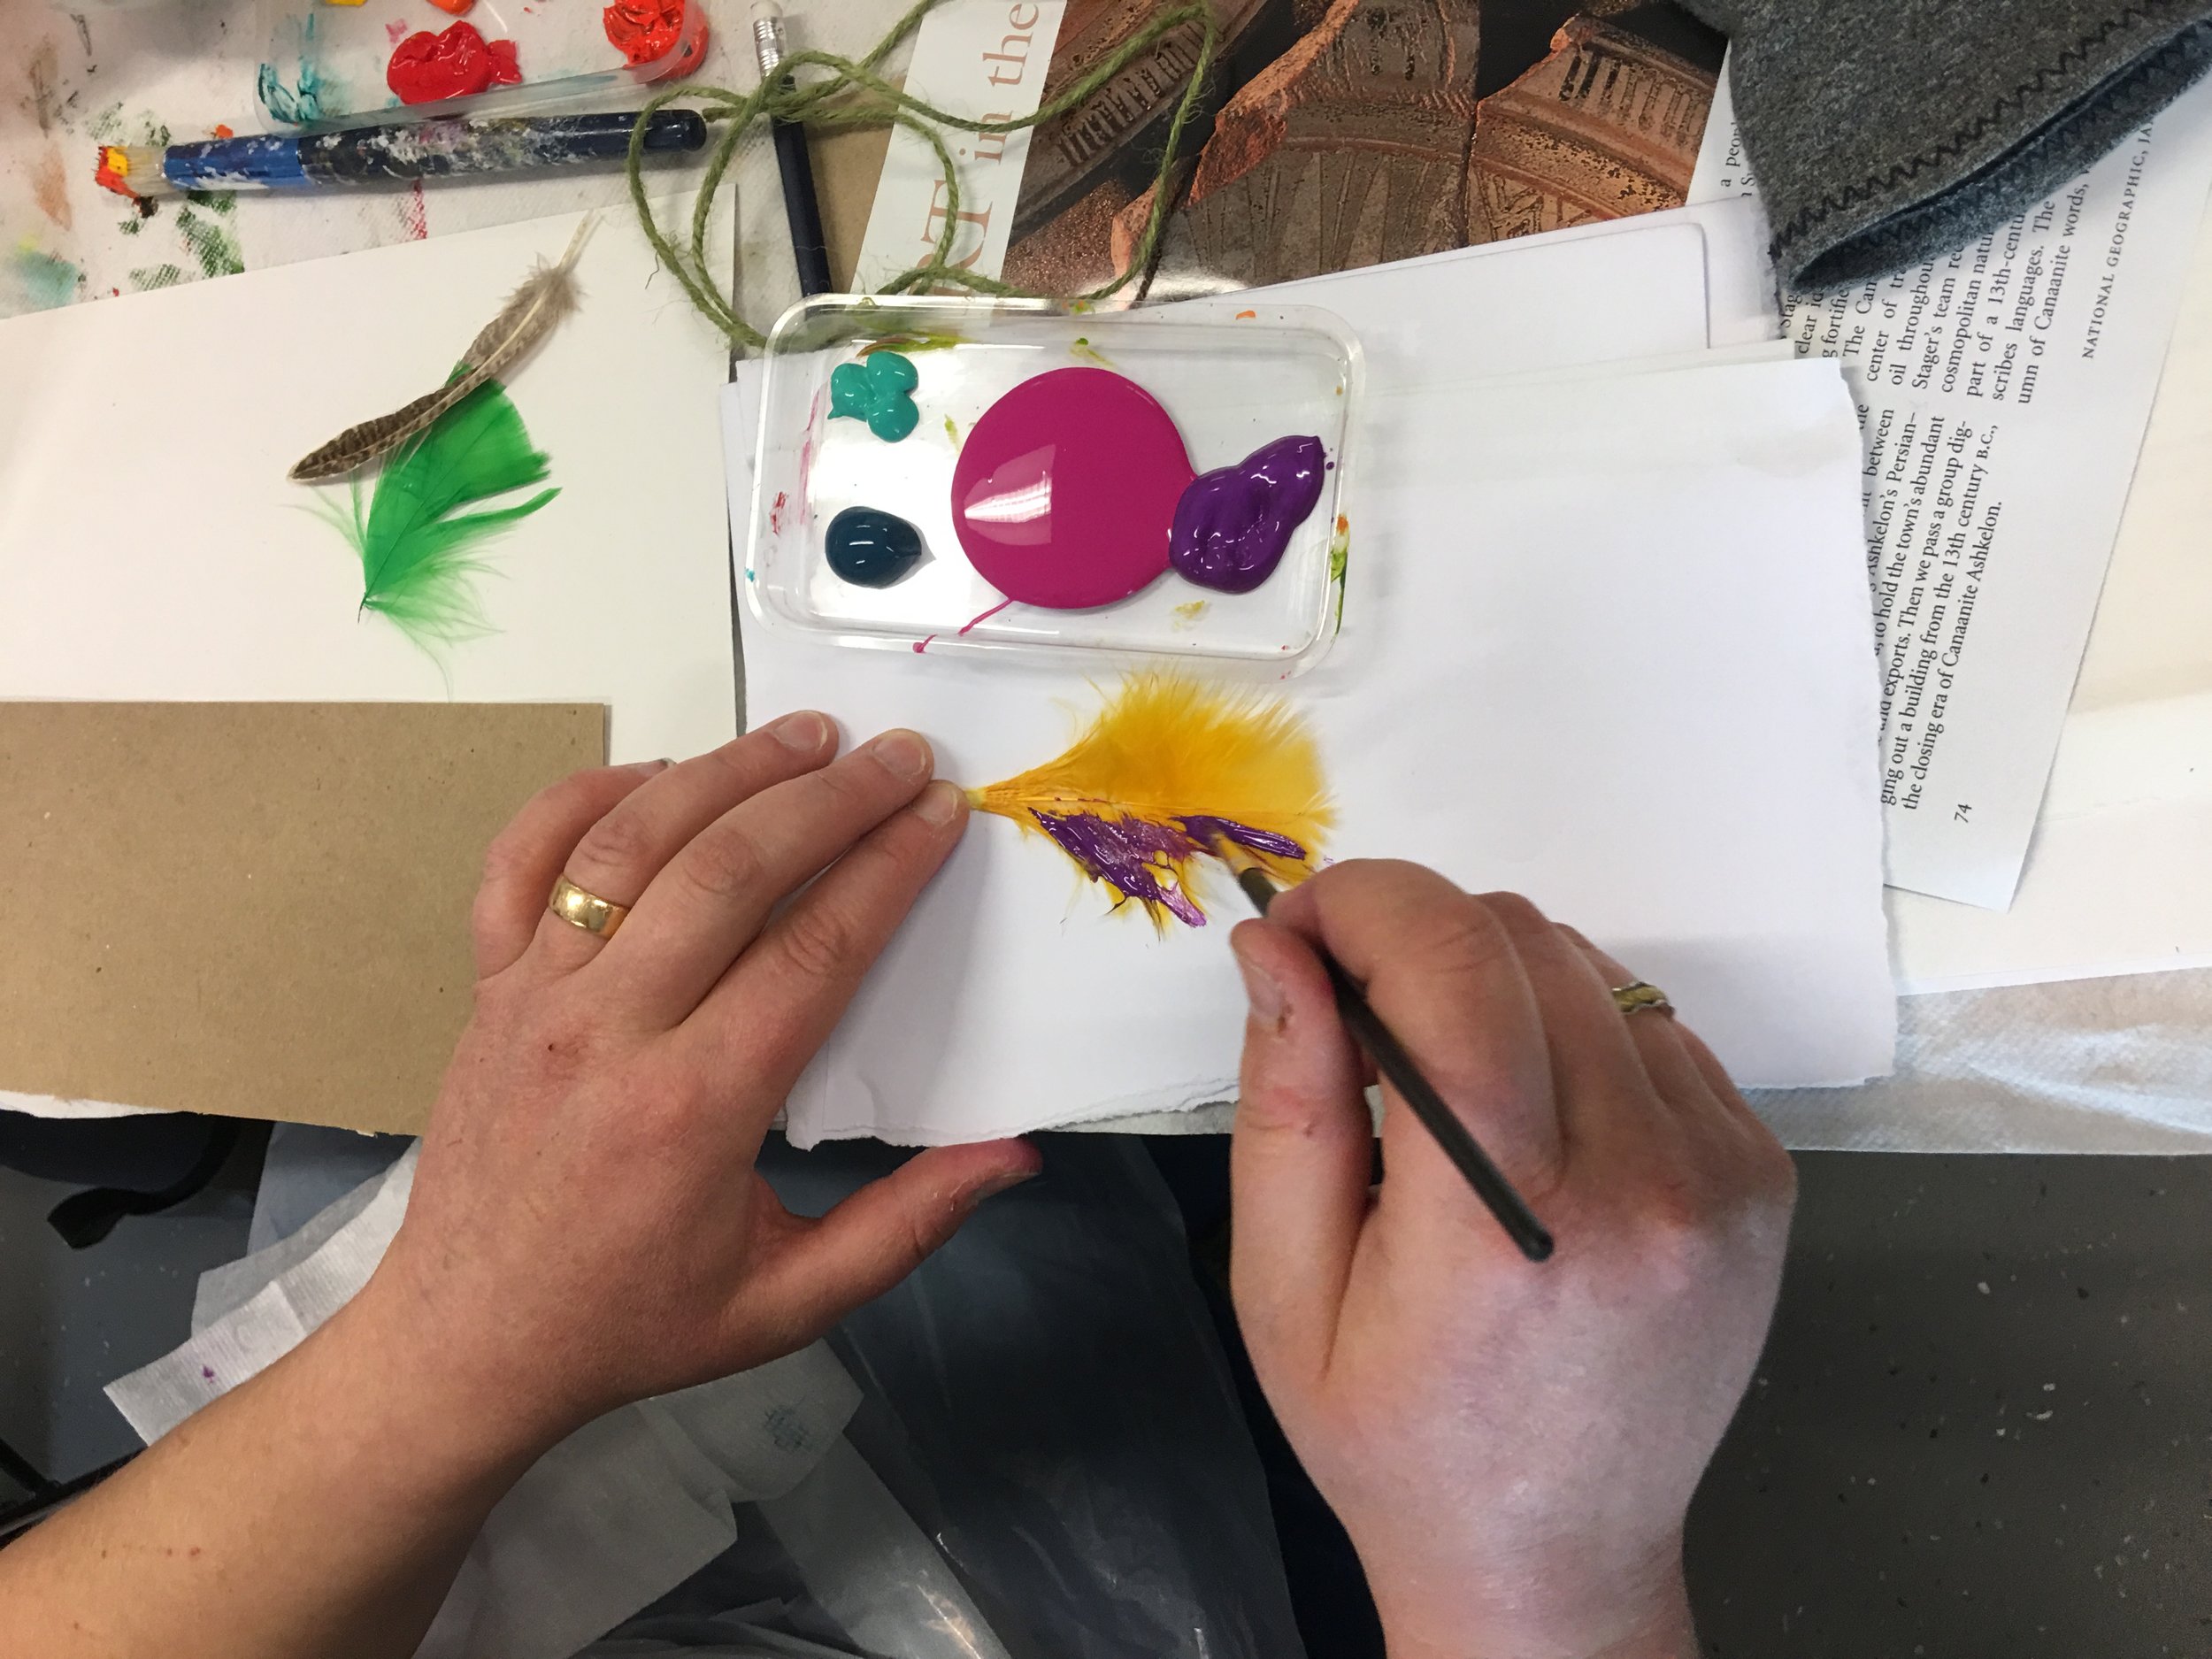
Finding flow in artmaking during an Arts on Referral Programme. Photo Jane Willis.
NHS Gloucestershire’s Creative Health Data Dashboard was co-designed by arts and health partners alongside people with lived experience. Combining NHS patient data with evidence gathered from arts and health activity, it aims to evidence the value of Creative Health, changing the narrative in Gloucestershire from it being “a nice to have” to “a need to have”.
The Data Dashboard was presented by Hannah Gorf from NHS Gloucestershire at the National Centre for Creative Health’s (NCCH) roundtable on data earlier this month. You can watch the presentation here, but in case you’re short on time (TL;DR as the digital natives say), I thought I would summarize my key takeaways:
Arts and Health partners should work together to agree what’s of value and what to measure.
An integrated approach to data collection reduces the monitoring burden on arts partners.
Qualitative evaluation illuminates the figures, winning hearts (stories) and minds (stats).
People with lived experience play an important role in helping to interpret the data, identifying insights, learning, and action.
Work together to agree what’s of value and what to measure
The drive to develop the Gloucestershire’s Creative Health Data Dashboard came from a desire to prove the value of Creative Health and change the narrative from it being a “nice to have” to “a need to have”.
The Data Dashboard wasn’t something that happened overnight. It took time, commitment and a coordinated co-production built on a decade of joint working stretching back to the Cultural Commissioning Programme funded by Arts Council England between 2013 – 2016.
The first step towards this involved bringing together people with lived experience, arts partners, clinicians and NHS commissioners to agree what is of value and what to measure. Aware that “unless you measure what you value, you will end up valuing what you measure”, they set up a Co-Production Group to agree what to collect.
An integrated approach to data collection reduces the monitoring burden on arts partners
Central to the Data Dashboard is a participant’s NHS number. This number enables data collected through creative health activity - such as participant attendance and changes in health and wellbeing identified using the MYCaW outcomes measure - to be linked to information held by the NHS, including data relating to a participant’s use of health services 6 months prior and 12 months after taking part in creative health activity, demographics and data on wider health inequalities. The NHS number also enables the Dashboard to collate information on how participants have been referred to the activity
The Data Dashboard is supported by careful data protection and security measures and supported by a range of specialist expertise to ensure safety and confidentiality.
By accessing data linked to each participant’s NHS number, the Data Dashboard not only enables NHS Gloucestershire to combine and analyze a wide set of data, but also reduces the monitoring burden on arts partners.
Qualitative evaluation illuminates the figures, winning hearts (stories) and minds (stats)
Alongside quantitative data (the figures), qualitative evaluation (stories of subjective experience) are used to contextualize the data and capture hearts as well as minds.
For example, the data shows that when people engage in creative health activity, they are less likely to use urgent care but more likely to increase their use of primary care. Looking at the qualitative data and talking to those with lived experience in the Co-Production Group helps NHS Gloucestershire to understand why this happens. Those who take part in creative health activities share experiences and receive support from others in the group. As a result, they feel less anxious about their health, and more confident to seek help before they reach a crisis. They are therefore more likely to talk to a GP when they need to, rather than wait and end up needing emergency care.
People with lived experience play an important role in helping to interpret the data
However, what’s most inspiring about the way in which NHS Gloucestershire is using the Data Dashboard isn’t the amount of data they are collecting, but the way in which they are working in a collaborative and integrated way to interpret and act on the data. The numbers are taken back to the Co-Production Group, which works to sense check them, identifying learning as well as improvements that can be actioned.
For example, the Dashboard shows which GP surgeries are referring to creative health and which are not, which means the Co-Production Group can target those who are not referring with increased information around the value of creative health.
From proving to improving
Hannah summarized the impact of the Data Dashboard when she said that although they had set it up to capture data to prove the value of creative health, they were now using it to improve the process of delivery.